System Activity
Purpose
Visualize how document uploads trend over the selected period. The System Activity section on the administrator dashboard includes a Documents Uploaded line chart tied to the dashboard date range.
Note: This action may require administrator privileges.
Prerequisites
- You are signed in to EisenVault One as a system administrator.
- You can open Dashboard from the left navigation.
Before You Begin
- The chart totals match the New Documents overview card for the same period.
- The badge Selected period reminds you that the chart follows the dashboard date filter.
- Point-level values come from daily upload counts returned by the audit-trails dashboard API.
View the Documents Uploaded Chart
- Open Dashboard.
- Set the date range, then click Apply Filter.
- Scroll to System Activity.
- Read the total beside Documents Uploaded.
- Hover chart points to compare daily upload volume across the period.
Example Walkthrough
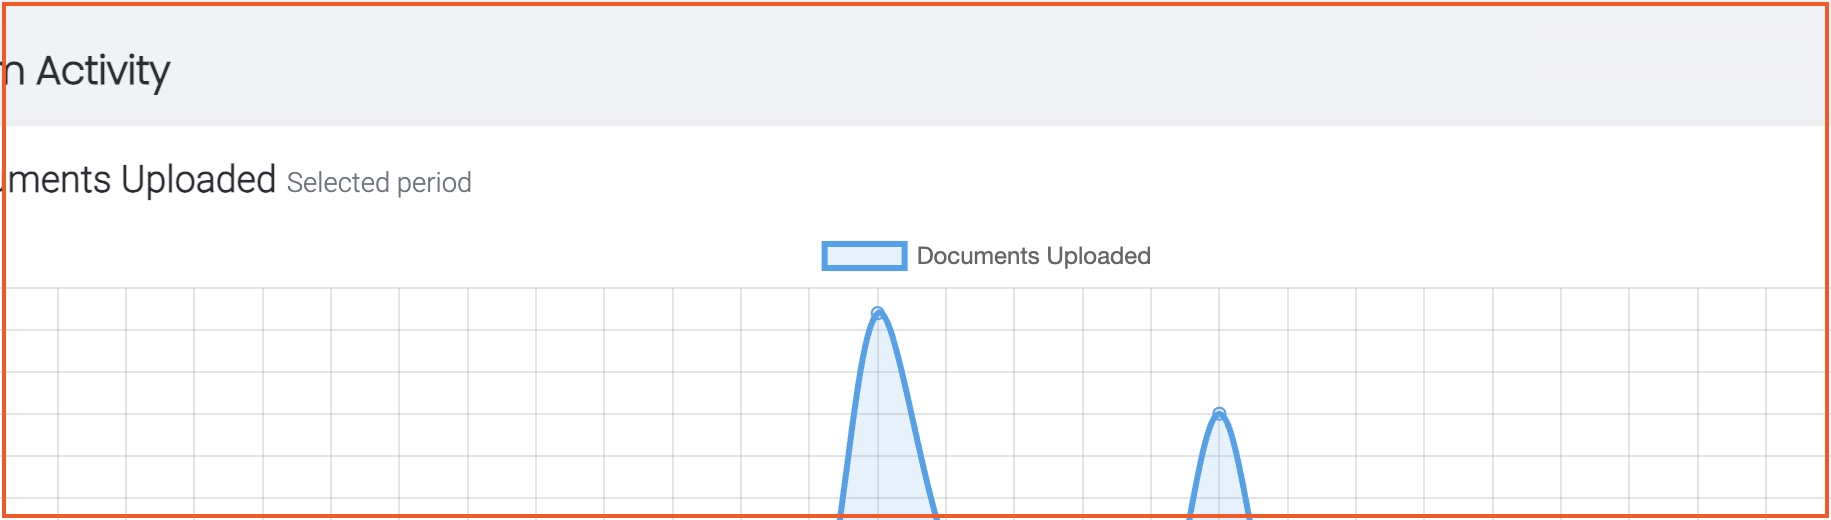
Demonstration screenshots highlight the line chart area.
-
The Documents Uploaded chart appears beside the Extension donut chart.
-
Change the date range and click Apply Filter to refresh both the chart and the New Documents card.
Expected Result
- The chart redraws when the dashboard date range changes.
- The headline total equals the New Documents count for that range.
- An empty period shows a flat or zero baseline.