Dashboard Overview
Purpose
The system administrator dashboard shows organization-wide document volume, user activity, storage consumption, and quick paths into admin tasks. EisenVault One uses the same /dashboard URL as the regular user dashboard; users with the Sign in to Admin Portal permission see this administrator view instead of the personal dashboard.
Prerequisites
- You are signed in to EisenVault One with system administrator permissions.
- You can open Dashboard from the left navigation.
- Additional admin areas such as Users, Settings, and Admin Tools appear in the navigation for your account.
Before You Begin
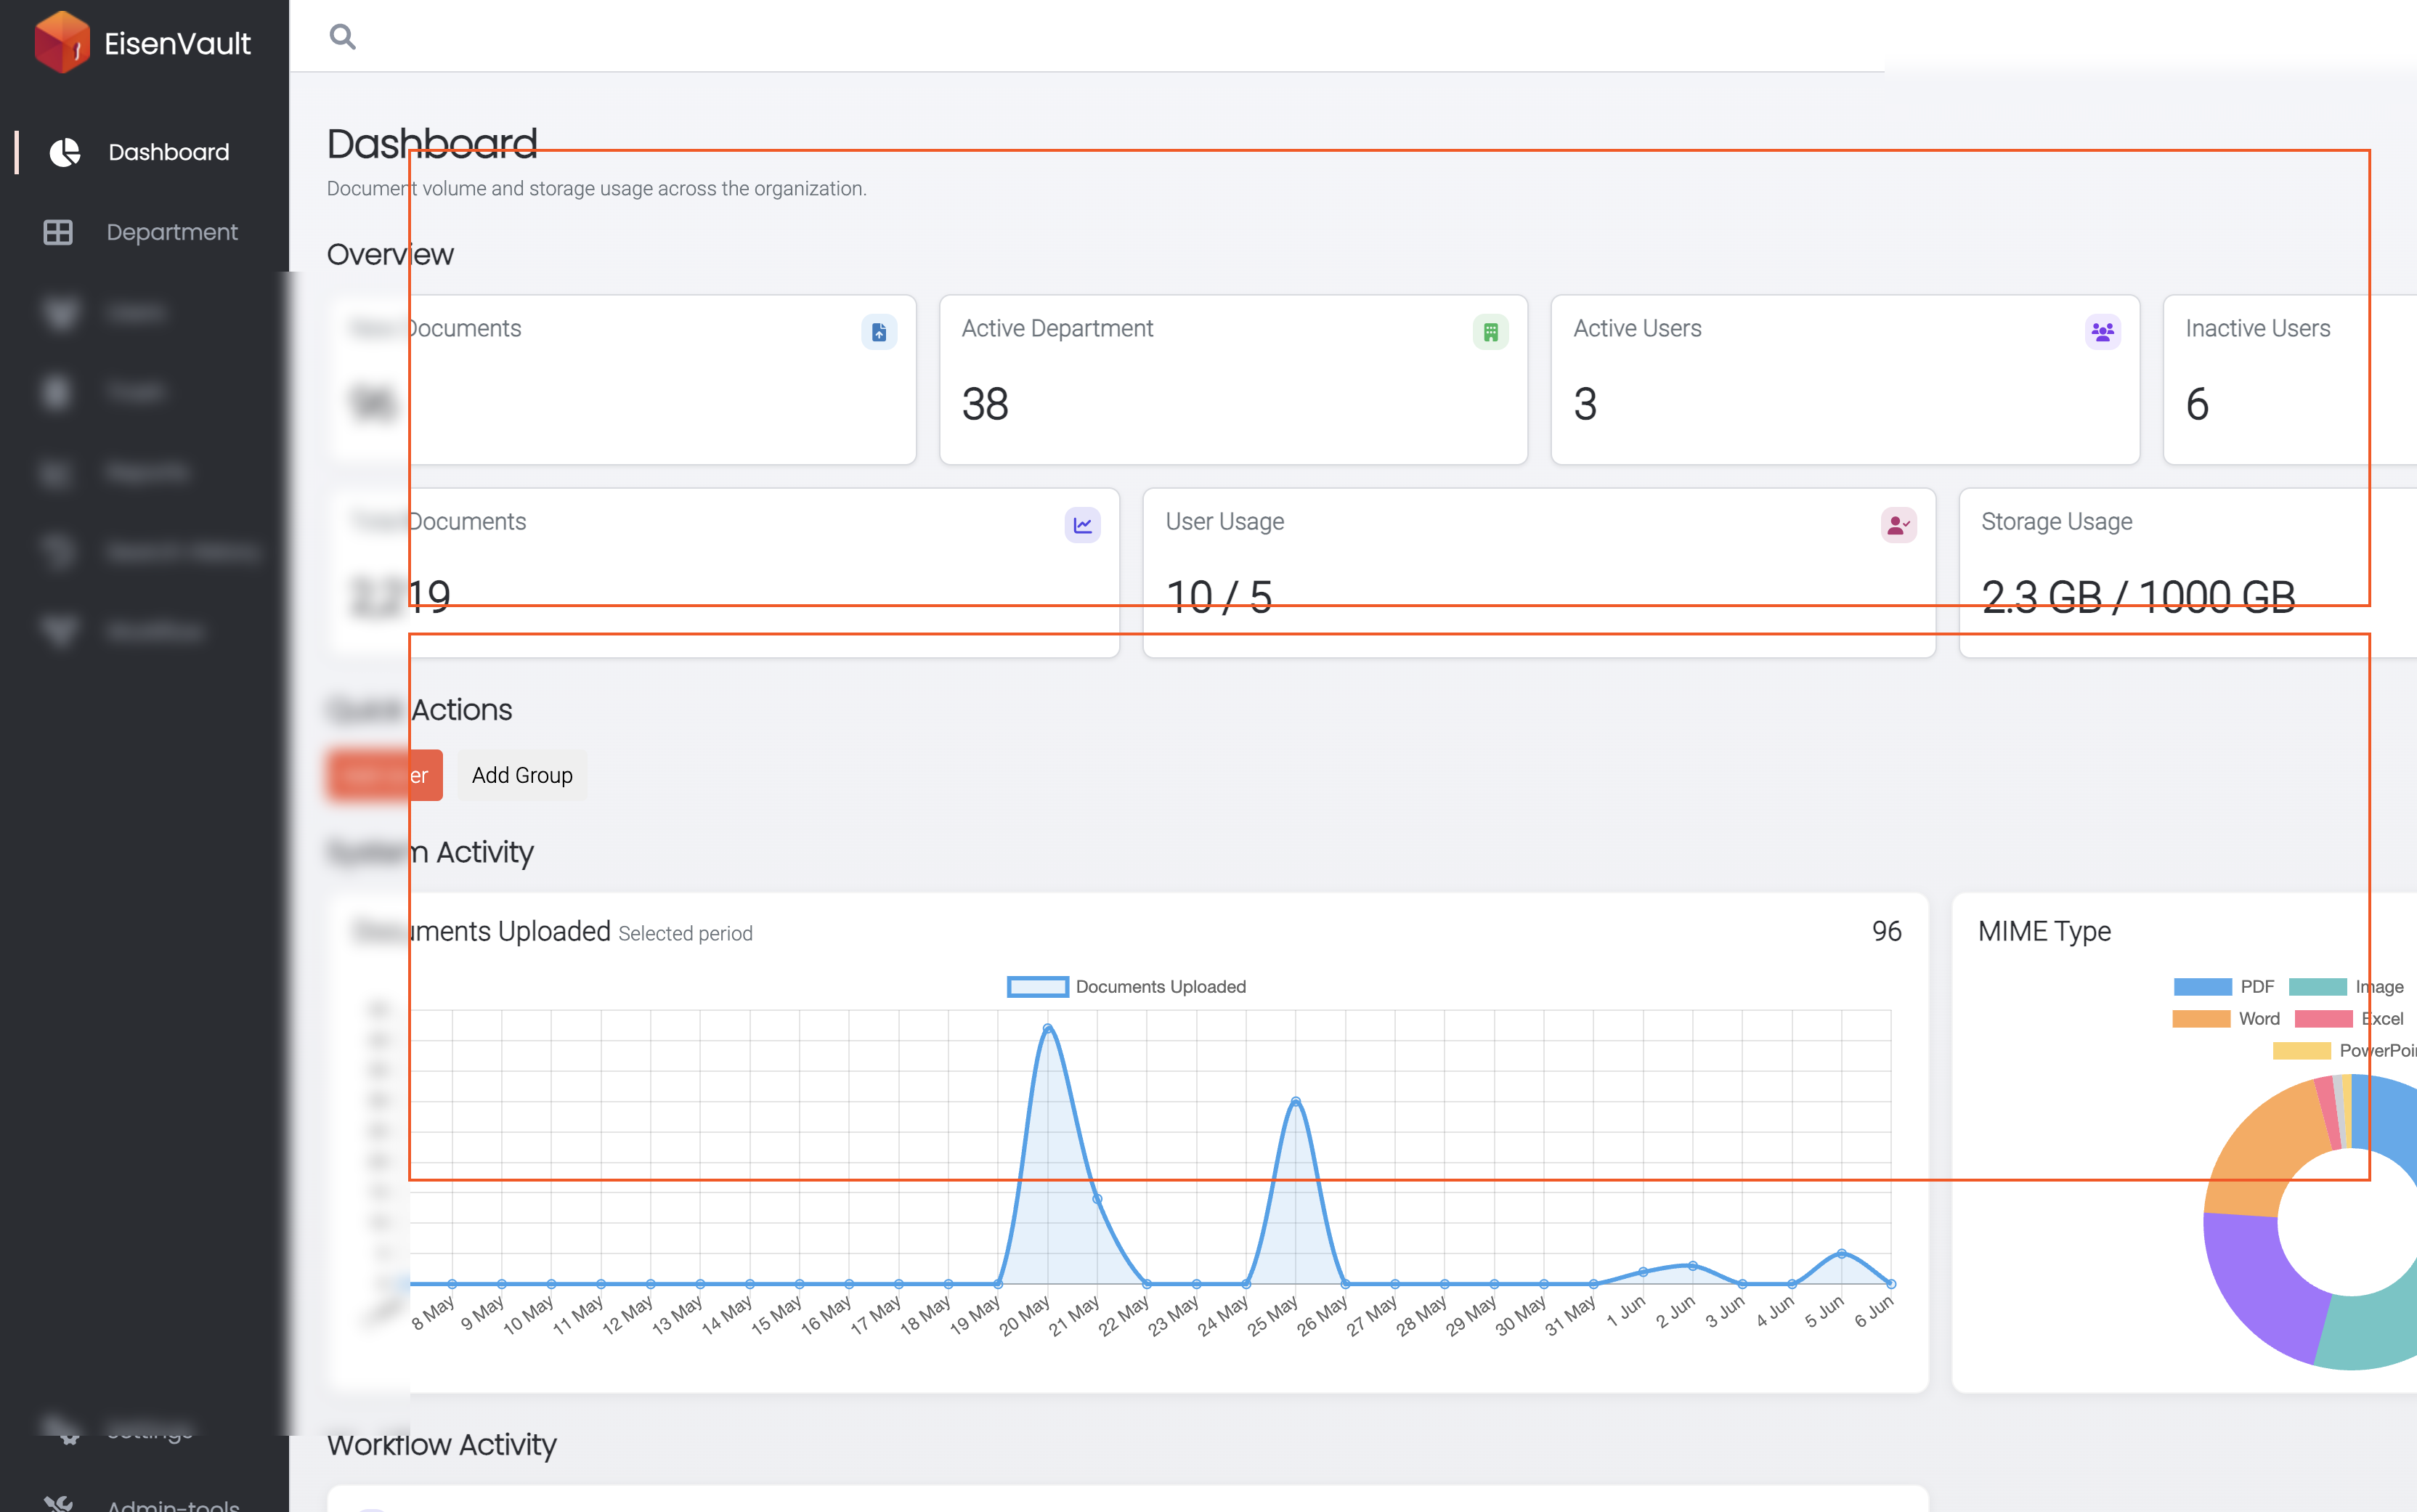
The administrator dashboard has four sections:
Overview cards
Two rows of KPI cards summarize the organization for the selected date range (except where noted):
| Card | Guide | Drill-down |
|---|---|---|
| New Documents | Uploads in the period | List of created documents |
| Active Department | Departments with activity | Department activity list |
| Active Users | Users who signed in | Active users list |
| Inactive Users | Users without sign-in | Inactive users list |
| Total Documents | All-time document count | Full repository list |
| User Usage | Licensed seats used | User directory list |
| Storage Usage | Storage consumed | Recalculate on the card |
Drag cards within their row to reorder them. EisenVault One saves card order on your profile.
Quick Actions
Shortcuts to Add User, Add Group, and Create Workflow without opening the admin menus first.
System Activity
Charts for documents uploaded in the selected period and Extension distribution.
Workflow Activity
Workflow metrics (Published, Active runs, and Draft counts) and a pending approvals feed when workflow features are enabled in your environment.
Open the Administrator Dashboard
- Sign in with a system administrator account.
- Click Dashboard in the left navigation.
- Confirm the subtitle Document volume and storage usage across the organization.
- Set the date range for period-based metrics, then click Apply Filter.
Example Walkthrough
Demonstration screenshots use redacted user, email, and department data.
-
The administrator dashboard shows KPI cards, quick actions, and charts on one page.
-
Click any KPI card that supports drill-down to open its list page. Use Back to return.
Expected Result
- Overview counts and charts refresh when you change the date range and click Apply Filter.
- Clickable cards open sortable list pages.
- Card order persists per administrator profile.
- Quick Actions opens Users or Admin Tools > Groups with the add dialog ready.